Zipfian Postulate
Nothing like a good old VSauce video to get the mind wandering. Zipf’s law states that words in a language will appear in a
I’ve been curious about the 80-20 rule for a little while and I thought I would start with taking a gander at Pareto distributions.
Pareto Conjecture
A Pareto distribution is one that has 80 percent of the resources are distributed to 20 percent of the population. I was curious about comparing population size plotted by inverse frequency to the resulting 80-20 sumation, so I wrote a quick and dirty python function to add up the inverse frequency values of the first 20 and final 80 percent of a distribution with population size as a command line input. My hypothesis was that “given a population relative to the quantities humans typically encounter, the resulting distribution would follow the 80-20 rule”.
Code
import sys


def pareto(n):
    n = int(n)
    sum20 = 0.0
    sum80 = 0.0
    for i in range(1, n+1):
        if i < n*0.2:
            sum20 += 1.0/i
        else:
            sum80 += 1.0/i
    total = sum20 + sum80
    print("Sum 20: {:0.3f}  {:0.3f}%".format(sum20, sum20/total))
    print("Sum 80: {:0.3f}  {:0.3f}%".format(sum80, sum80/total))
    print("Total: %f" % total)

pareto(sys.argv[1])
Demo
python3 pareto-conjecture.py 1800
Sum 20: 6.462  0.800%
Sum 80: 1.611  0.200%
Total: 8.073035
Resulting Observations
- any population size between
~400and~30000is within 5% of the 80-20 rule - any population size between
~120and~10000000is within 10% of the 80-20 rule ~1800is roughtly the center of the 80-20 split
TLDR: My hypothesis was correct.
Zipfian Musings
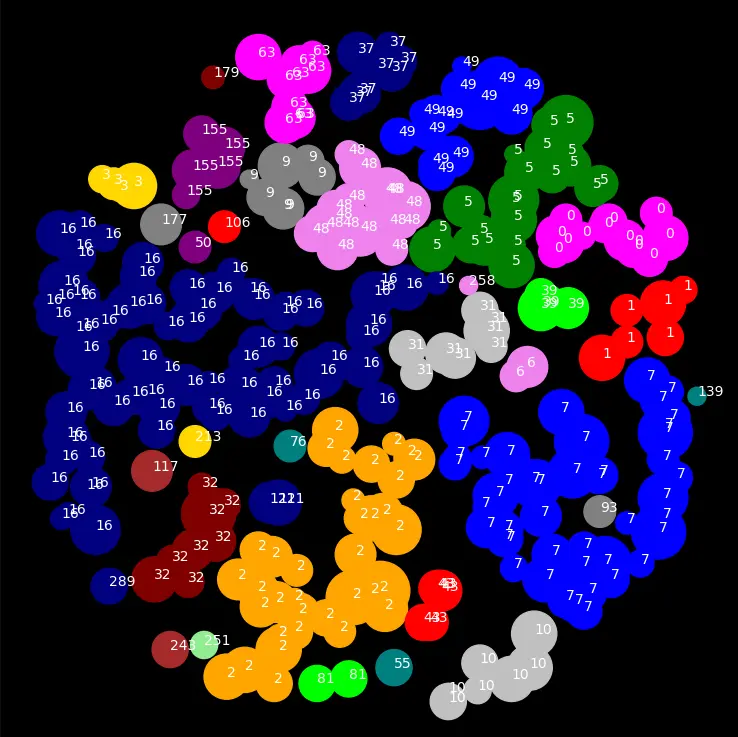
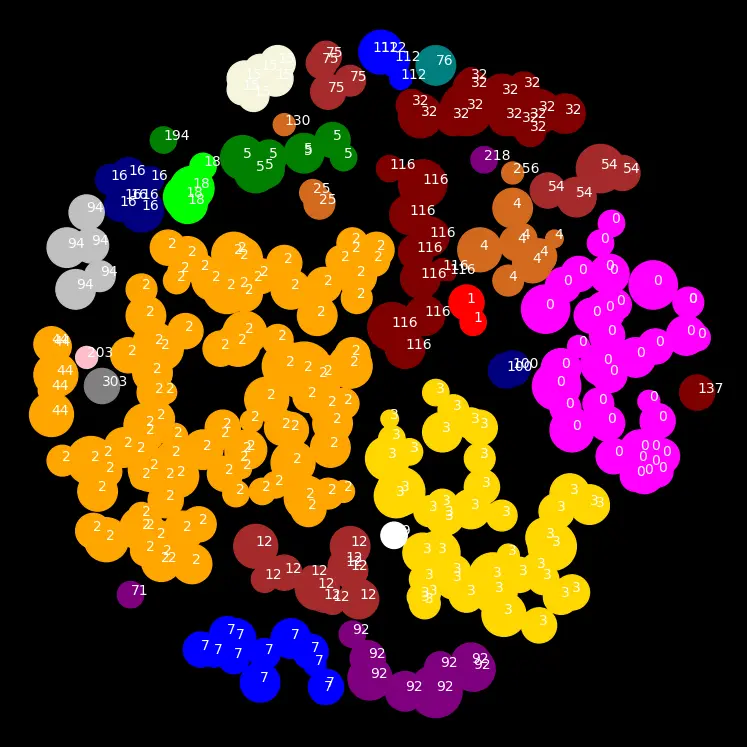
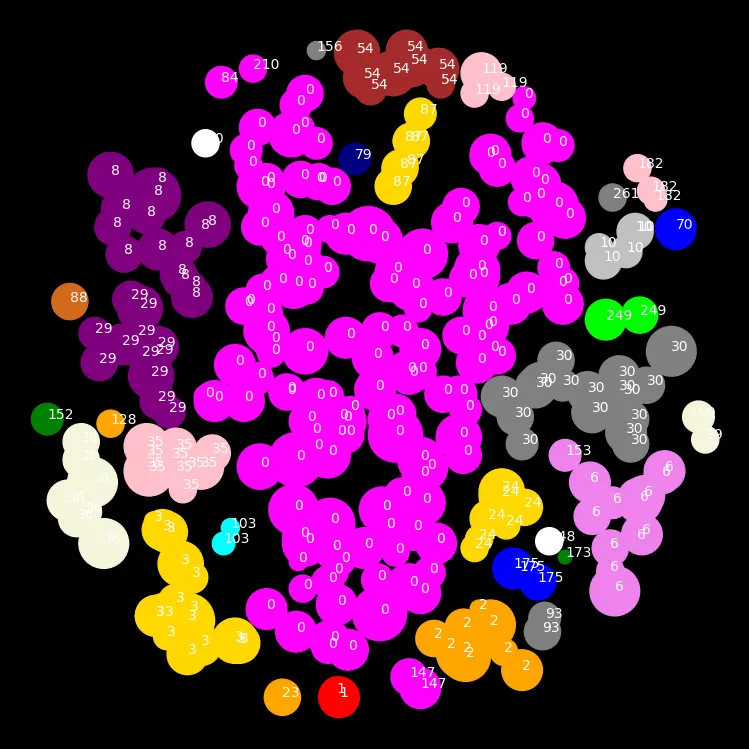
Per Vsauce’s video and subsequent research on the topic, it seemed to me like most Zipfian models seemed to be a spherical surface impacted at various points by some function. For instance, the moon’s surface is impacted by asteroids, whose impact force follows some function. I thought I would try my hand at coding this as well, landing “asteroids” on the “moon” and clustering the resulting formations to see if the cluster areas would appear roughly Zipfian. Per the asteroid impact force, I initially tried a uniformly random function but quickly switched to a guassian probability function.
There are plenty of variables to try and adjust, I attempted to keep them all as derivatives of the “global map size”. I definitely recommend trying the code for yourself and seeing how close to Zipfian you can get ;).
from random import randint
from math import sqrt
import numpy as np


mapRange = 300
asteroidSize = int(sqrt(mapRange))
asteroidAmount = int(mapRange**2/asteroidSize**2)

impacts = []

for i in range(asteroidAmount):
    while True:
        x = randint(0, mapRange)
        y = randint(0, mapRange)
        # r = randint(1, asteroidSize) # uniform random
        r = int(np.random.normal(0.5, 0.1, 1) * asteroidSize) # guassian

        if sqrt((x - mapRange/2)**2 + (y - mapRange/2)**2) < mapRange/2:
            break

    impacts.append( [x, y, r, i] )
    impacts.sort(key = lambda x:x[3])

    properlyAdded = False
    while not properlyAdded:
        properlyAdded = True

        for j in impacts:
            for k in impacts:
                dist = sqrt((j[0] - k[0])**2 + (j[1] - k[1])**2)
                combRad = j[2] + k[2]

                if dist <= combRad:
                    if j[3] == k[3]:
                        continue
                    elif j[3] < k[3]:
                        k[3] = j[3]
                        properlyAdded = False
                    else:
                        j[3] = k[3]
                        properlyAdded = False


import matplotlib.pyplot as plt

plt.figure(figsize=(15,10), facecolor="black")
ax = plt.gca()

ax.spines['bottom'].set_color('white')
ax.spines['top'].set_color('white')
ax.spines['right'].set_color('white')
ax.spines['left'].set_color('white')
ax.tick_params(axis='x', colors='white')
ax.tick_params(axis='y', colors='white')
ax.yaxis.label.set_color('white')
ax.xaxis.label.set_color('white')
ax.title.set_color('white')
ax.set_facecolor('xkcd:black')
colors = ["magenta", "red", "orange", "gold", "chocolate", "green", "violet", "blue", "purple", "gray", "silver", "maroon", "brown", "teal", "pink", "beige", "navy", "white", "lime", "cyan", "lightgreen"]

for impact in impacts:
    circle = plt.Circle((impact[0], impact[1]), color=colors[impact[3]%len(colors)], radius=impact[2])
    ax.add_patch(circle)
    ax.text(impact[0], impact[1], impact[3], color="white")

plt.axis('scaled')
plt.show()
Example Results


